The IPCC’s Sixth Assessment Report: Key Points
IPCC’s Sixth Assessment Report: The IPCC, Intergovernmental Panel on Climate Change, “is the United Nations body for assessing the science related to climate change”1 that was created to give policymakers routine climate change assessments -including implications and potential dangers concerning climate change, and new proposals for adaptation and mitigation.1 You may have heard this report referred to as the UN’s Climate Change Report or AR6.
This article will focus on the Summary for Policymakers, Chapter 3, Chapter 4, and Chapter 11 of the AR6.

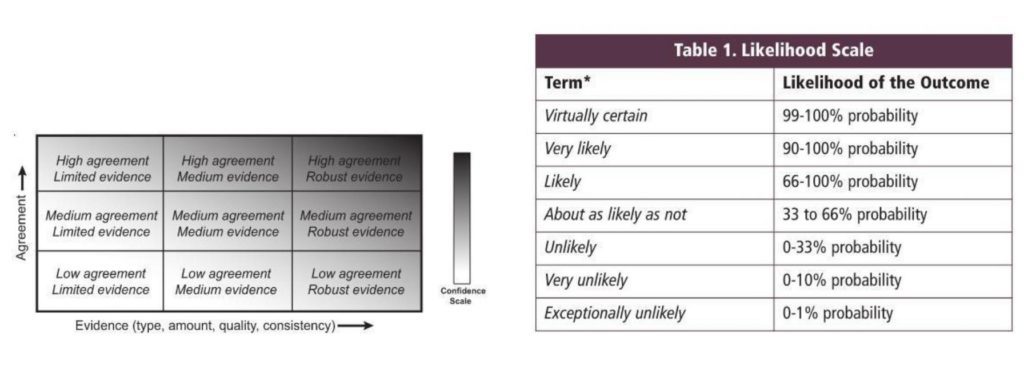
Note: The terms “very low,” “low,” “medium,” “high,” and “very high” confidence are used to express a judgment on the finding’s validity, determined through evaluation and agreement.2 Reference likelihood using the scale below:
“It is unequivocal that human influence has warmed the atmosphere, ocean and land. Widespread and rapid changes in the atmosphere, ocean, cryosphere and biosphere have occurred.”3
Anthropogenic Forces And The Current State Of The Climate; In Reference To The IPCC’s Sixth Assessment Report
Since 1750 or pre-industrial times, the increases in greenhouse gas concentrations have been caused by human activities. Using measurements from AR5, annual average atmospheric greenhouse concentrations have increased to “410 ppm for carbon dioxide (CO2), 1866 ppb for methane (CH4), and 332 ppb for nitrous oxide (N2O) in 2019.”3 The last four decades have each been warmer than the previous decade.3
Atmosphere
Chapter 3 of the full AR6 updates information on human influence from AR5 with improved simulations of “paleoclimates on continental scales.” Humans have provoked global warming and the estimated range of human-induced global-mean surface air temperature (GSAT) warming between 2010 and 2019 compared to 1850 and 1900 is 0.8°C–1.3°C. This is alarming because observed warming is 0.9°C–1.2°C and to natural warming causes is responsible for just −0.1°C–0.1°C. It is hard to pinpoint specific anthropogenic forces behind the observed warming. Greenhouse gases “likely increased GSAT by 1.0°C–2.0°C, while other anthropogenic forcings including aerosols likely decreased GSAT by 0.0°C–0.8°C.” Greenhouse gas increases -accredited by humans- were the main cause of tropospheric warming since 1979 satellite observations. Stratospheric ozone depletion, also human-induced, was “the main driver of cooling in the lower stratosphere between 1979 and the mid-1990s.”4
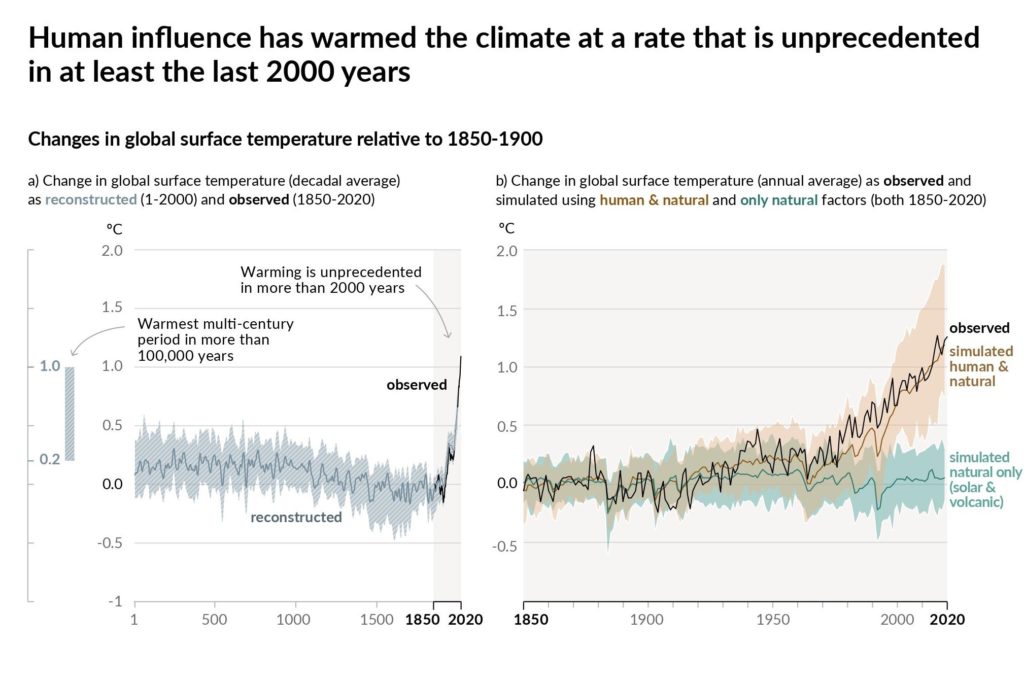
Greenhouse gases produced by humans are behind the “hot and cold extremes”4 we are seeing globally. These anthropogenic gases have also driven the increase in heavy in-land precipitation globally.4
Some recent natural disasters may come to mind, like Hurricane Ida or the California fires. Hurricane Ida wreaked havoc with its flash floods and “killed at least 43 people in New York, New Jersey, Pennsylvania, and Connecticut.”5 Ida made landfall in New Orleans as a Category 4 storm on the 16th anniversary of Hurricane Katrina’s landfall.6 In California, “more than 7,400 wildfires have burned..this year,”7 burning over 2.2 million acres.
“Some recent hot extreme events would have been extremely unlikely to occur without human influence on the climate system.”8
More on extreme weather and climate events in the section Extreme Events.
Cryosphere
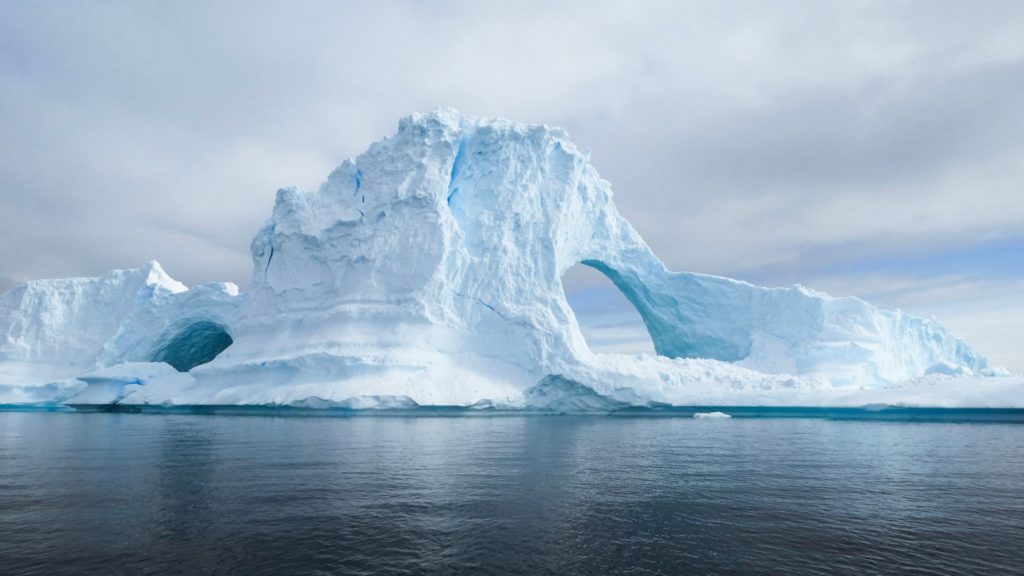
Since the late 70s, the greenhouse gas increases humans have generated has led to ice loss in the Arctic, and “there is new evidence that increases in anthropogenic aerosols have offset part of the greenhouse gas-induced Arctic sea ice loss since the 1950s.” Reductions in spring snow cover in the Northern Hemisphere, “near-universal retreat of glaciers,” and the Greenland Ice Sheet’s surface melting has very likely all been contributed to by human influence.
Greenland’s ice loss rate was about “one million tons a minute in 2019.”9 Together, Greenland and Antarctica have had 6.3 tons of ice dissipate since 1994.9
Ocean
Since the 1970s, the ocean’s heat content increase’s main driver is extremely likely human influence.4
Updated simulations of ocean heat content “show that warming extends throughout the entire water column (high confidence), with CMIP6 models simulating 58% of industrial-era heat uptake (1850 to 2014) in the upper layer (0–700 m), 21% in the intermediate layer (700–2000 m) and 22% in the deep layer (>2000 m).”4
Changes in near-surface and subsurface oceanic salinity since the mid-20th century is extremely likely due to human influence and there is a pattern of freshwater “regions becoming fresher and salty regions becoming saltier.” The main cause behind salinity changes is human influences as both the new AR6 models and the previous models only replicate these patterns “in simulations that include greenhouse gas increases.” Human influence is very likely behind the increases in global mean thermosteric sea level since 1970 observations as simulations do not show the historical/observed sea-level rise without factoring in anthropogenic greenhouse gases.
Biosphere
The seasonal cycle of atmospheric CO2’s amplitude has increased due to “enhanced fertilization of plant growth by the increasing concentration of atmospheric CO2.” The increase in subtropical and equatorial North Atlantic CO2 concentrations (observed since 2000) has a likely association with the increase in ocean temperature. The increase in ocean temperature is expected to weaken the ocean’s carbon sink. A carbon sink -for example, forests, soils, and the ocean- absorbs more carbon from the atmosphere than it releases.10
“It is virtually certain that the uptake of anthropogenic CO2 was the main driver of the observed acidification of the global ocean.”4
Extreme Events
Human influences, like greenhouse gas emissions, aerosol emissions, and changes in land use, have -and will- induce weather and climate extremes at an increased frequency and intensity.8 Observations of these extremes and evidence of its relationship with human influences have increased since AR5. Since AR5, there has been growth in understanding processes, more scientific literature, and increased climate model accessibility. Accordingly, there is increased confidence when looking at past and future extreme weather and climate changes.8
“The extremes considered include temperature extremes, heavy precipitation and pluvial floods, river floods, droughts, storms (including tropical cyclones), as well as compound events (multivariate and concurrent extremes).”8
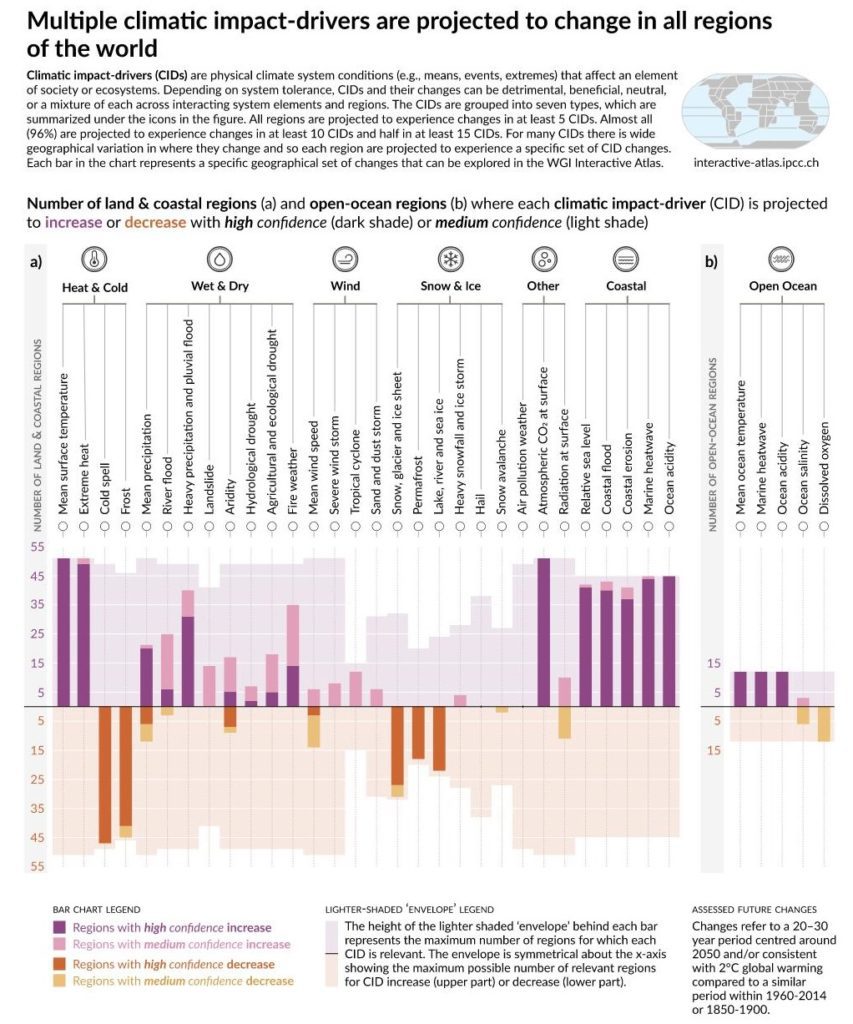
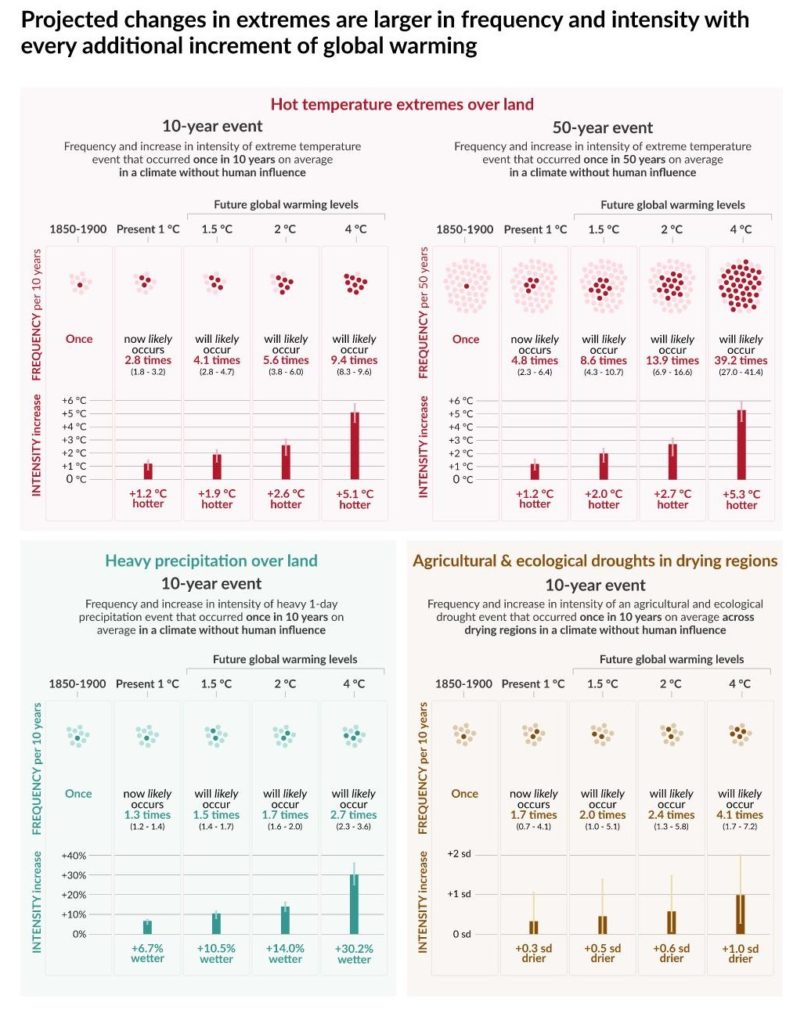
It is virtually certain that since 1950, hot extremes have increased in frequency and intensity while cold extremes have decreased globally.8 As global warming levels increase, this trend will continue -and, unfortunately, “this will be the case even if global warming is stabilized at 1.5°C.”8
“Human-induced greenhouse gas forcing is the main driver of the observed changes in hot and cold extremes on the global scale (virtually certain) and on most continents (very likely).”8
Higher greenhouse gas concentrations can either moderate or intensify extreme temperatures through regional processes like snow and ice-albedo feedbacks, or regional forcing from land use and cover changes.8 The albedo effect refers to the reflection of sunlight as it “hits a white surface such as snow and ice,”11 unlike a dark surface that would absorb the heat. A decrease in snow/ice would mean a decrease in surface albedo which allows for intensified solar heating.12
Seemingly with medium confidence, irrigation and crop expansion have reduced summer hot extreme increases in some places, like the U.S. Midwest While urbanization has likely intensified extreme temperature changes in cities, “in particular for night-time extremes.” Heavy precipitation events frequency and intensity have also likely increased globally and anthropogenic greenhouse gas emissions are likely the main cause. With continued global warming there will be more frequent and intense heavy precipitation, which in turn, will bring an increase in the “frequency and magnitude of pluvial floods – surface water and flash floods – (high confidence), as pluvial flooding results from precipitation intensity exceeding the capacity of natural and artificial drainage systems.”
Droughts (agricultural and ecological) would be induced by a lack of sufficient soil moisture; the lack of soil moisture would be intensified by increased atmospheric evaporative demand (AED).8 Climate change, pushed by humans, has led to decreases in water availability in a large portion of land area in the dry season because of evapotranspiration increases; and “precipitation deficits and changes in evapotranspiration (ET) govern net water availability.”8 With high confidence, evapotranspiration increases have been pushed by increased atmospheric evaporative demand, and the AED increases were prompted by “increased temperature, decreased relative humidity, and increased net radiation.”8
“human-induced climate change has contributed to increased agricultural and ecological droughts (MED, WNA), and increased hydrological drought (MED) in some regions.”8
Unfortunately, even if global warming is stabilized, between 1.5°C-2°C of global warming, many regions will face harsh agricultural and ecological droughts.8
Globally, there will be an increase in the average and maximum rain associated with tropical cyclones (TCs), extratropical cyclones, and atmospheric rivers.
“It is likely that the global proportion of major TC (Category 3–5) intensities over the past four decades has increased.”
Natural variability alone cannot explain the global frequency of tropical cyclone intensification events; the proportion of intense tropical cyclones and their average peak wind speeds will increase globally with global warming increasing.

“The probability of compound flooding (storm surge, extreme rainfall and/or river flow) has increased in some locations, and will continue to increase due to both sea level rise and increases in heavy precipitation, including changes in precipitation intensity associated with TCs (high confidence).”
With high confidence, concurrent extremes affecting land area have increased. So has the possibility of these concurrent extreme events happening in one location, but affecting other regions -like through food supply. This will “become more frequent with increasing global warming, in particular above 2°C of global warming.”
The Possible Future In Reference To The IPCC’s Sixth Assessment Report
In the next 20 years, a 1.5°C increase in global-mean surface air temperature (GSAT) is likely to occur; the likelihood that the GSAT, by 2030 in any individual year could exceed 1.5°C is between 40% and 60%.13
“It is virtually certain that the average surface warming will continue to be higher over land than over the ocean and that the surface warming in the Arctic will continue to be more pronounced than the global average over the 21st century.”13
The annual land precipitation rate of change between the years 2081 and 2100 compared to the years 1995–2014 is –0.2–4.7% (the low-emission scenario). The high-emission scenario is 0.9–12.9%.13 Larger land areas will face “statistically significant increases or decreases in precipitation”13 with increasing warming.
In the Northern Hemisphere, land monsoon precipitation is likely to increase while monsoon circulation weakens.13
“It is likely that at least one large volcanic eruption will occur during the 21st century. Such an eruption would reduce GSAT for several years, decrease global-mean land precipitation, alter monsoon circulation, modify extreme precipitation, and change the profile of many regional climatic impact drivers.”13
Through this century, “it is virtually certain that global mean sea level (GMSL) will continue to rise”13 and that the total (ocean and land) carbon uptake will increase to the end of this century is very likely.13 Throughout this century, ocean surface pH will decrease, but in two models the surface pH decreases until 2070 and then increases slightly until 2100.13
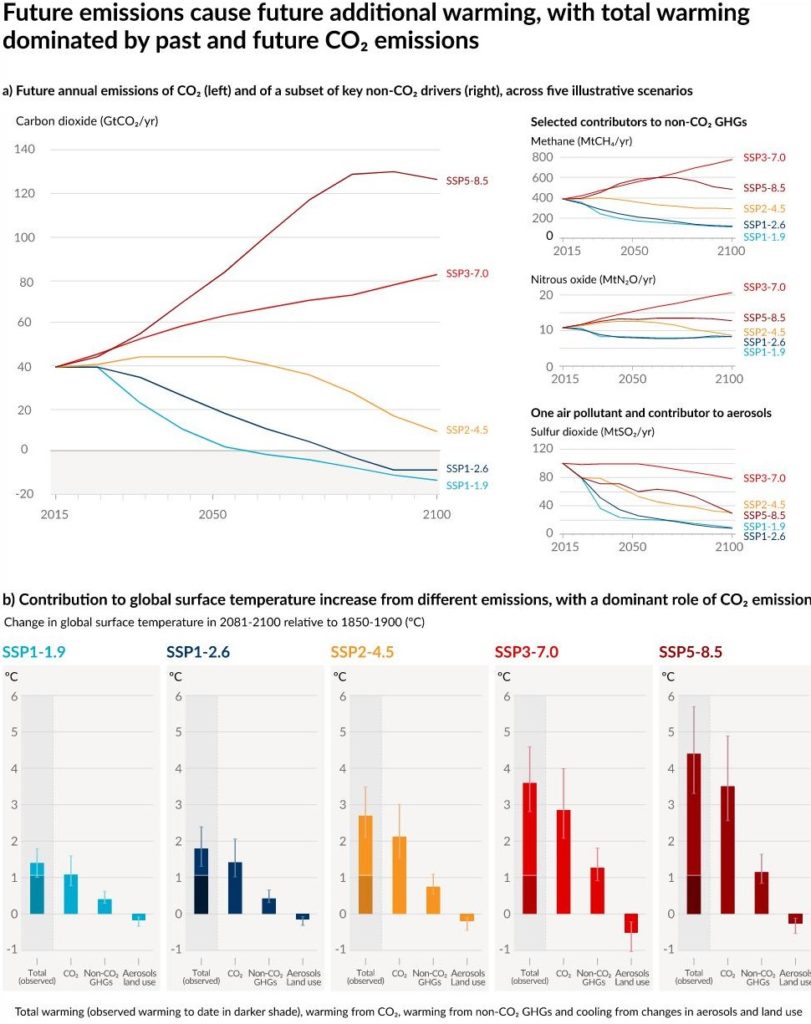
In the most optimistic scenario, SSP1-1.9 (reference chart above) the strong mitigation applied would show new trends in the next 20 years (2021–2040) in comparison to scenarios, SSP3-7.0 and SSP5-8.5, where no mitigation is taking place.13
Cumulative carbon emissions and GSAT change have a near-linear relationship, meaning that “cooling or avoided warming from carbon dioxide removal (CDR) is proportional to the cumulative amount of CO2 removed by CDR (high confidence).”13 If net negative CO2 emissions are achieved, a response will be “delayed by years to centuries,”13 keeping in mind that net negative CO2 emissions do not mean the reversal of climate change effects, like sea-level rise -at least not quickly as a “reversal” would take several centuries.13
To limit “human-induced global warming to a specific level,”3 there needs to be a cumulative CO2 emission limit, net-zero CO2 emissions need to be reached, and other greenhouse gas emissions need to be reduced too (like CH4, Methane).3 What has the potential to remove CO2 from the atmosphere? Anthropogenic CO2 removal (CDR). CDR has the potential to remove and store CO2 in reservoirs.3
“CDR aims to compensate for residual emissions to reach net zero CO2 or net zero GHG emissions or, if implemented at a scale where anthropogenic removals exceed anthropogenic emissions, to lower surface temperature.”3
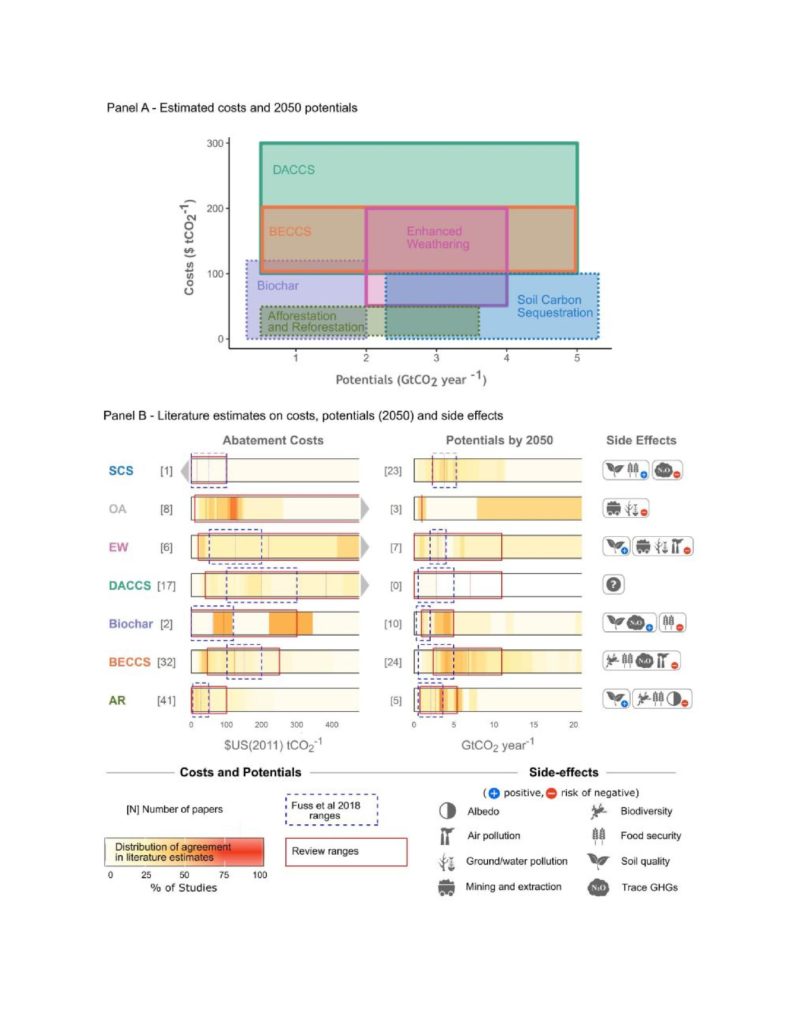
CDR methods, like bioenergy, or even afforestation and reforestation,14 can potentially affect biogeochemical cycles and the climate, plus have influences on water availability and quality, food production, and biodiversity.”3 CDR methods include bioenergy, afforestation and reforestation, soil carbon sequestration and biochar, enhanced weathering (EW) and ocean alkalinization, direct air carbon dioxide capture and storage (DACCS), and ocean fertilization.15
Bioenergy is energy -heat, electricity, and liquid or gas fuel- derived from biomass.16 Bioenergy with carbon capture and storage (BECCS) refers to the carbon emissions from bioenergy conversion being sequestered and “stored in geological formations or embedded in long-lasting products.”16 The cost estimates for BECCS cost estimates are below 200 USD tCO2 but vary widely.15 However, there is low agreement on land availability for this CDR method.15 BECCS is constrained by “bioenergy’s carbon accounting, land, water and nutrient requirements”15 plus aligning policy goals and limited public acceptance.

Afforestation and reforestation, respectively, is planting trees in an area that did not have trees and planting trees in an area where tree numbers are decreasing.17
“Afforestation implies planting trees on land not forested for a long time (e.g., over the last 50 years in the context of the Kyoto Protocol), while reforestation implies re-establishment of forest formations after a temporary condition with less than 10% canopy cover due to human induced or natural perturbation”15
The cost for this CDR method is low in comparison to others.15 However, afforestation and reforestation would require a larger amount of land and water than BECCS.15
Soil carbon sequestration is the process of soils absorbing and storing more carbon.18
“Increasing soil carbon is accomplished in three key ways: (1) switching to low-till or no-till practices; (2) using cover crops and leaving crop residues to decay; and (3) using species or varieties with greater root mass.”18
Biochar is made from burning biomass at 300–600°C without oxygen and then, put into the soil where it can be stored.18 Biochar can improve soil fertility, but the method is constrained by the maximum capacity of biochar soils can hold safely.15 Soil carbon sequestration has small enough water and energy requirements so it wouldn’t affect nutrients and food security badly; “However, soil sinks saturate after 10–100 years, depending on the SCS option, soil type, and climate zone.”15
In chemical weathering, acid rain reacts with rocks and soil, eventually breaking the sediment down, and forming bicarbonate; the bicarbonate is swept into the ocean where the carbon can be stored in its dissolved form or on the seafloor.19 “Enhanced weathering scales up this process”19 and pulverizing silicate rocks instead of waiting for them to weather. Ocean alkalinization refers to the process of “adding alkaline substances to seawater to enhance the ocean’s natural carbon sink.”20 Some of the drawbacks from the enhanced weathering (EW) and ocean alkalinization method include “the release of heavy metals like Ni and Cr and plant nutrients like K, Ca, Mg, P and Si”15 and the potential for health impacts by respirable particle sizes.15
Direct air carbon dioxide capture and storage (DACCS) is done by mechanical systems capturing CO2 directly from the atmosphere and then compressing it so it can be “injected into geological storage or used to make long-lasting products, such as cement.”21
Some techniques “use chemicals that bind with CO2 in the air and release the CO2 when heated. Others use changes in temperature, humidity, or electrical charge to capture and release CO2.”21
DACCS faces limits in the availability of safe and accessible geological storage and may require more energy than the captured flue gas (the gas from combustion) CO2.15
Ocean fertilization is a form of environmental system manipulation, geoengineering, where nutrients are added to the upper, sunlit, layers of the ocean “to stimulate phytoplankton activity”22 to decrease atmospheric CO2 levels since phytoplankton photosynthesize. Unfortunately, for this method, “there is limited evidence and low agreement”15 for its readiness for rapid decarbonization. Other issues include biodiversity concerns since nitrogen fertilization can stimulate algal blooms, lead to deep water oxygen decline, and impact food webs.15
Read More About The IPCC’s Sixth Assessment Report
For the full IPCC Sixth Assessment Report, the individual chapters, and the Summary for Policymakers, visit: https://www.ipcc.ch/report/ar6/wg1/#FullReport Could the IPCC’s Sixth Assessment Report shed light on the future of the ecology of Orlando Wetlands? Read about the ecology of the Orlando wetlands here.
Sources
- “The Intergovernmental Panel on Climate Change.” IPCC, www.ipcc.ch/.
- “Guidance Note for Lead Authors of the IPCC Fifth Assessment Report on Consistent Treatment of Uncertainties.” IPCC, www.ipcc.ch/site/assets/uploads/2017/08/AR5_Uncertainty_Guidance_Note.pdf.
- IPCC, 2021: Summary for Policymakers. In: Climate Change 2021: The Physical Science Basis. Contribution of Working Group I to the Sixth Assessment Report of the Intergovernmental Panel on Climate Change [MassonDelmotte, V., P. Zhai, A. Pirani, S.L. Connors, C. Péan, S. Berger, N. Caud, Y. Chen, L. Goldfarb, M.I. Gomis, M. Huang, K. Leitzell, E. Lonnoy, J.B.R. Matthews, T.K. Maycock, T. Waterfield, O. Yelekçi, R. Yu, and B. Zhou (eds.)]. Cambridge University Press. In Press. https://www.ipcc.ch/report/ar6/wg1/downloads/report/IPCC_AR6_WGI_SPM.pdf
- Chapter 3, IPCC, 2021: Climate Change 2021: The Physical Science Basis. Contribution of Working Group I to the Sixth Assessment Report of the Intergovernmental Panel on Climate Change Eyring, V., N.P. Gillett, K.M. Achuta Rao, R. Barimalala, M. Barreiro Parrillo, N. Bellouin, C. Cassou, P.J. Durack, Y. Kosaka, S. McGregor, S. Min, O. Morgenstern, and Y. Sun, 2021: Human Influence on the Climate System. In Climate Change 2021: The Physical Science Basis. Contribution of Working Group I to the Sixth Assessment Report of the Intergovernmental Panel on Climate Change [Masson-Delmotte, V., P. Zhai, A. Pirani, S.L. Connors, C. Péan, S. Berger, N. Caud, Y. Chen, L. Goldfarb, M.I. Gomis, M. Huang, K. Leitzell, E. Lonnoy, J.B.R. Matthews, T.K. Maycock, T. Waterfield, O. Yelekçi, R. Yu, and B. Zhou (eds.)]. Cambridge University Press. In Press. https://www.ipcc.ch/report/ar6/wg1/downloads/report/IPCC_AR6_WGI_Chapter_03.pdf
- Schweber, Nate, and Jesse McKinley. “Flooding from Ida Kills Dozens of People in Four States.” The New York Times, The New York Times, 15 Sept. 2021, www.nytimes.com/live/2021/09/02/nyregion/nyc-storm.
- Mervosh, Sarah, et al. “New Orleans without Power as Hurricane Ida Batters Louisiana.” The New York Times, The New York Times, 10 Sept. 2021, www.nytimes.com/live/2021/08/29/us/hurricane-ida-live-updates-new-orleans-louisiana.
- Canon, Gabrielle. “California Wildfires Close Sequoia National Park and Prompt Evacuations.” The Guardian, Guardian News and Media, 15 Sept. 2021, www.theguardian.com/us-news/2021/sep/15/california-wildfire-knp-complex-latest.
- Chapter 11, IPCC, 2021: Climate Change 2021: The Physical Science Basis. Contribution of Working Group I to the Sixth Assessment Report of the Intergovernmental Panel on Climate Change Seneviratne, S.I., X. Zhang, M. Adnan, W. Badi, C. Dereczynski, A. Di Luca, S. Ghosh, I. Iskandar, J. Kossin, S. Lewis, F. Otto, I. Pinto, M. Satoh, S.M. Vicente-Serrano, M. Wehner, and B. Zhou, 2021: Weather and Climate Extreme Events in a Changing Climate. In Climate Change 2021: The Physical Science Basis. Contribution of Working Group I to the Sixth Assessment Report of the Intergovernmental Panel on Climate Change [MassonDelmotte, V., P. Zhai, A. Pirani, S.L. Connors, C. Péan, S. Berger, N. Caud, Y. Chen, L. Goldfarb, M.I. Gomis, M. Huang, K. Leitzell, E. Lonnoy, J.B.R. Matthews, T.K. Maycock, T. Waterfield, O. Yelekçi, R. Yu, and B. Zhou (eds.)]. Cambridge University Press. In Press. https://www.ipcc.ch/report/ar6/wg1/downloads/report/IPCC_AR6_WGI_Chapter_11.pdf
- Milman, Oliver. “Greenland: Enough Ice Melted on Single Day to Cover Florida in Two Inches of Water.” The Guardian, Guardian News and Media, 30 July 2021, www.theguardian.com/environment/2021/jul/30/greenland-ice-sheet-florida-water-climate-crisis.
- “Carbon Sources and Sinks.” National Geographic Society, 24 Mar. 2020, www.nationalgeographic.org/encyclopedia/carbon-sources-and-sinks/.
- Kinver, Mark. “Ice Loss Causing Arctic to Reflect Less Heat.” BBC News, BBC, 11 Nov. 2019, www.bbc.com/news/science-environment-50381328.
- Kashiwase, Haruhiko, et al. “Evidence for Ice-Ocean Albedo Feedback in the Arctic Ocean Shifting to a Seasonal Ice Zone.” Nature News, Nature Publishing Group, 15 Aug. 2017, www.nature.com/articles/s41598-017-08467-z.
- Chapter 4, IPCC, 2021: Climate Change 2021: The Physical Science Basis. Contribution of Working Group I to the Sixth Assessment Report of the Intergovernmental Panel on Climate Change Lee, J.-Y., J. Marotzke, G. Bala, L. Cao, S. Corti, J.P. Dunne, F. Engelbrecht, E. Fischer, J.C. Fyfe, C. Jones, A. Maycock, J. Mutemi, O. Ndiaye, S. Panickal, and T. Zhou: 2021, Future Global Climate: Scenario-Based Projections and Near-Term Information. In Climate Change 2021: The Physical Science Basis. Contribution of Working Group I to the Sixth Assessment Report of the Intergovernmental Panel on Climate Change [Masson-Delmotte, V., P. Zhai, A. Pirani, S.L. Connors, C. Péan, S. Berger, N. Caud, Y. Chen, L. Goldfarb, M.I. Gomis, M. Huang, K. Leitzell, E. Lonnoy, J.B.R. Matthews, T.K. Maycock, T. Waterfield, O. Yelekçi, R. Yu, and B. Zhou (eds.)]. Cambridge University Press. In Press. https://www.ipcc.ch/report/ar6/wg1/downloads/report/IPCC_AR6_WGI_Chapter_04.pdf.
- “FAQ Chapter 4.” Global Warming of 1.5 ºC, www.ipcc.ch/sr15/faq/faq-chapter-4/.
- Chapter 4, de Coninck, H., A. Revi, M. Babiker, P. Bertoldi, M. Buckeridge, A. Cartwright, W. Dong, J. Ford, S. Fuss, J.-C. Hourcade, D. Ley, R. Mechler, P. Newman, A. Revokatova, S. Schultz, L. Steg, and T. Sugiyama, 2018: Strengthening and Implementing the Global Response. In: Global Warming of 1.5°C. An IPCC Special Report on the impacts of global warming of 1.5°C above pre-industrial levels and related global greenhouse gas emission pathways, in the context of strengthening the global response to the threat of climate change, sustainable development, and efforts to eradicate poverty [Masson-Delmotte, V., P. Zhai, H.-O. Pörtner, D. Roberts, J. Skea, P.R. Shukla, A. Pirani, W. Moufouma-Okia, C. Péan, R. Pidcock, S. Connors, J.B.R. Matthews, Y. Chen, X. Zhou, M.I. Gomis, E. Lonnoy, T. Maycock, M. Tignor, and T. Waterfield (eds.)]. In Press. https://www.ipcc.ch/sr15/chapter/chapter-4/
- “Fact Sheet: Bioenergy with Carbon Capture and Storage (BECCS).” American University, www.american.edu/sis/centers/carbon-removal/fact-sheet-bioenergy-with-carbon-capture-and-storage-beccs.cfm.
- “What Is Reforestation and Afforestation?” Drax, 4 May 2021, www.drax.com/sustainable-bioenergy/what-is-reforestation-and-afforestation/#:~:text=Reforestation%20is%20the%20process%20of,before%2C%20creating%20a%20new%20forest.
- “Soil Carbon & Biochar.” Carbon Removal Fact Sheet: Soil Carbon & Biochar, American University , www.american.edu/sis/centers/carbon-removal/upload/icrlp_fact_sheet_soil_carbon_biochar_181006.pdf.
- “Guest Post: How ‘Enhanced Weathering’ Could Slow Climate Change and Boost Crop Yields.” Carbon Brief, 9 July 2020, www.carbonbrief.org/guest-post-how-enhanced-weathering-could-slow-climate-change-and-boost-crop-yields.
- “Ocean Alkalinization.” Ocean Alkalinization Fact Sheet , American University , www.american.edu/sis/centers/carbon-removal/upload/icrlp_fact_sheet_ocean_alkalinization_2020_update.pdf.
- “Fact Sheet: Direct Air Capture.” American University, www.american.edu/sis/centers/carbon-removal/fact-sheet-direct-air-capture.cfm
- Ocean Fertilization, 14 Nov. 2017, https://web.whoi.edu/ocb-fert/what-is-ocean-fertilization/


